

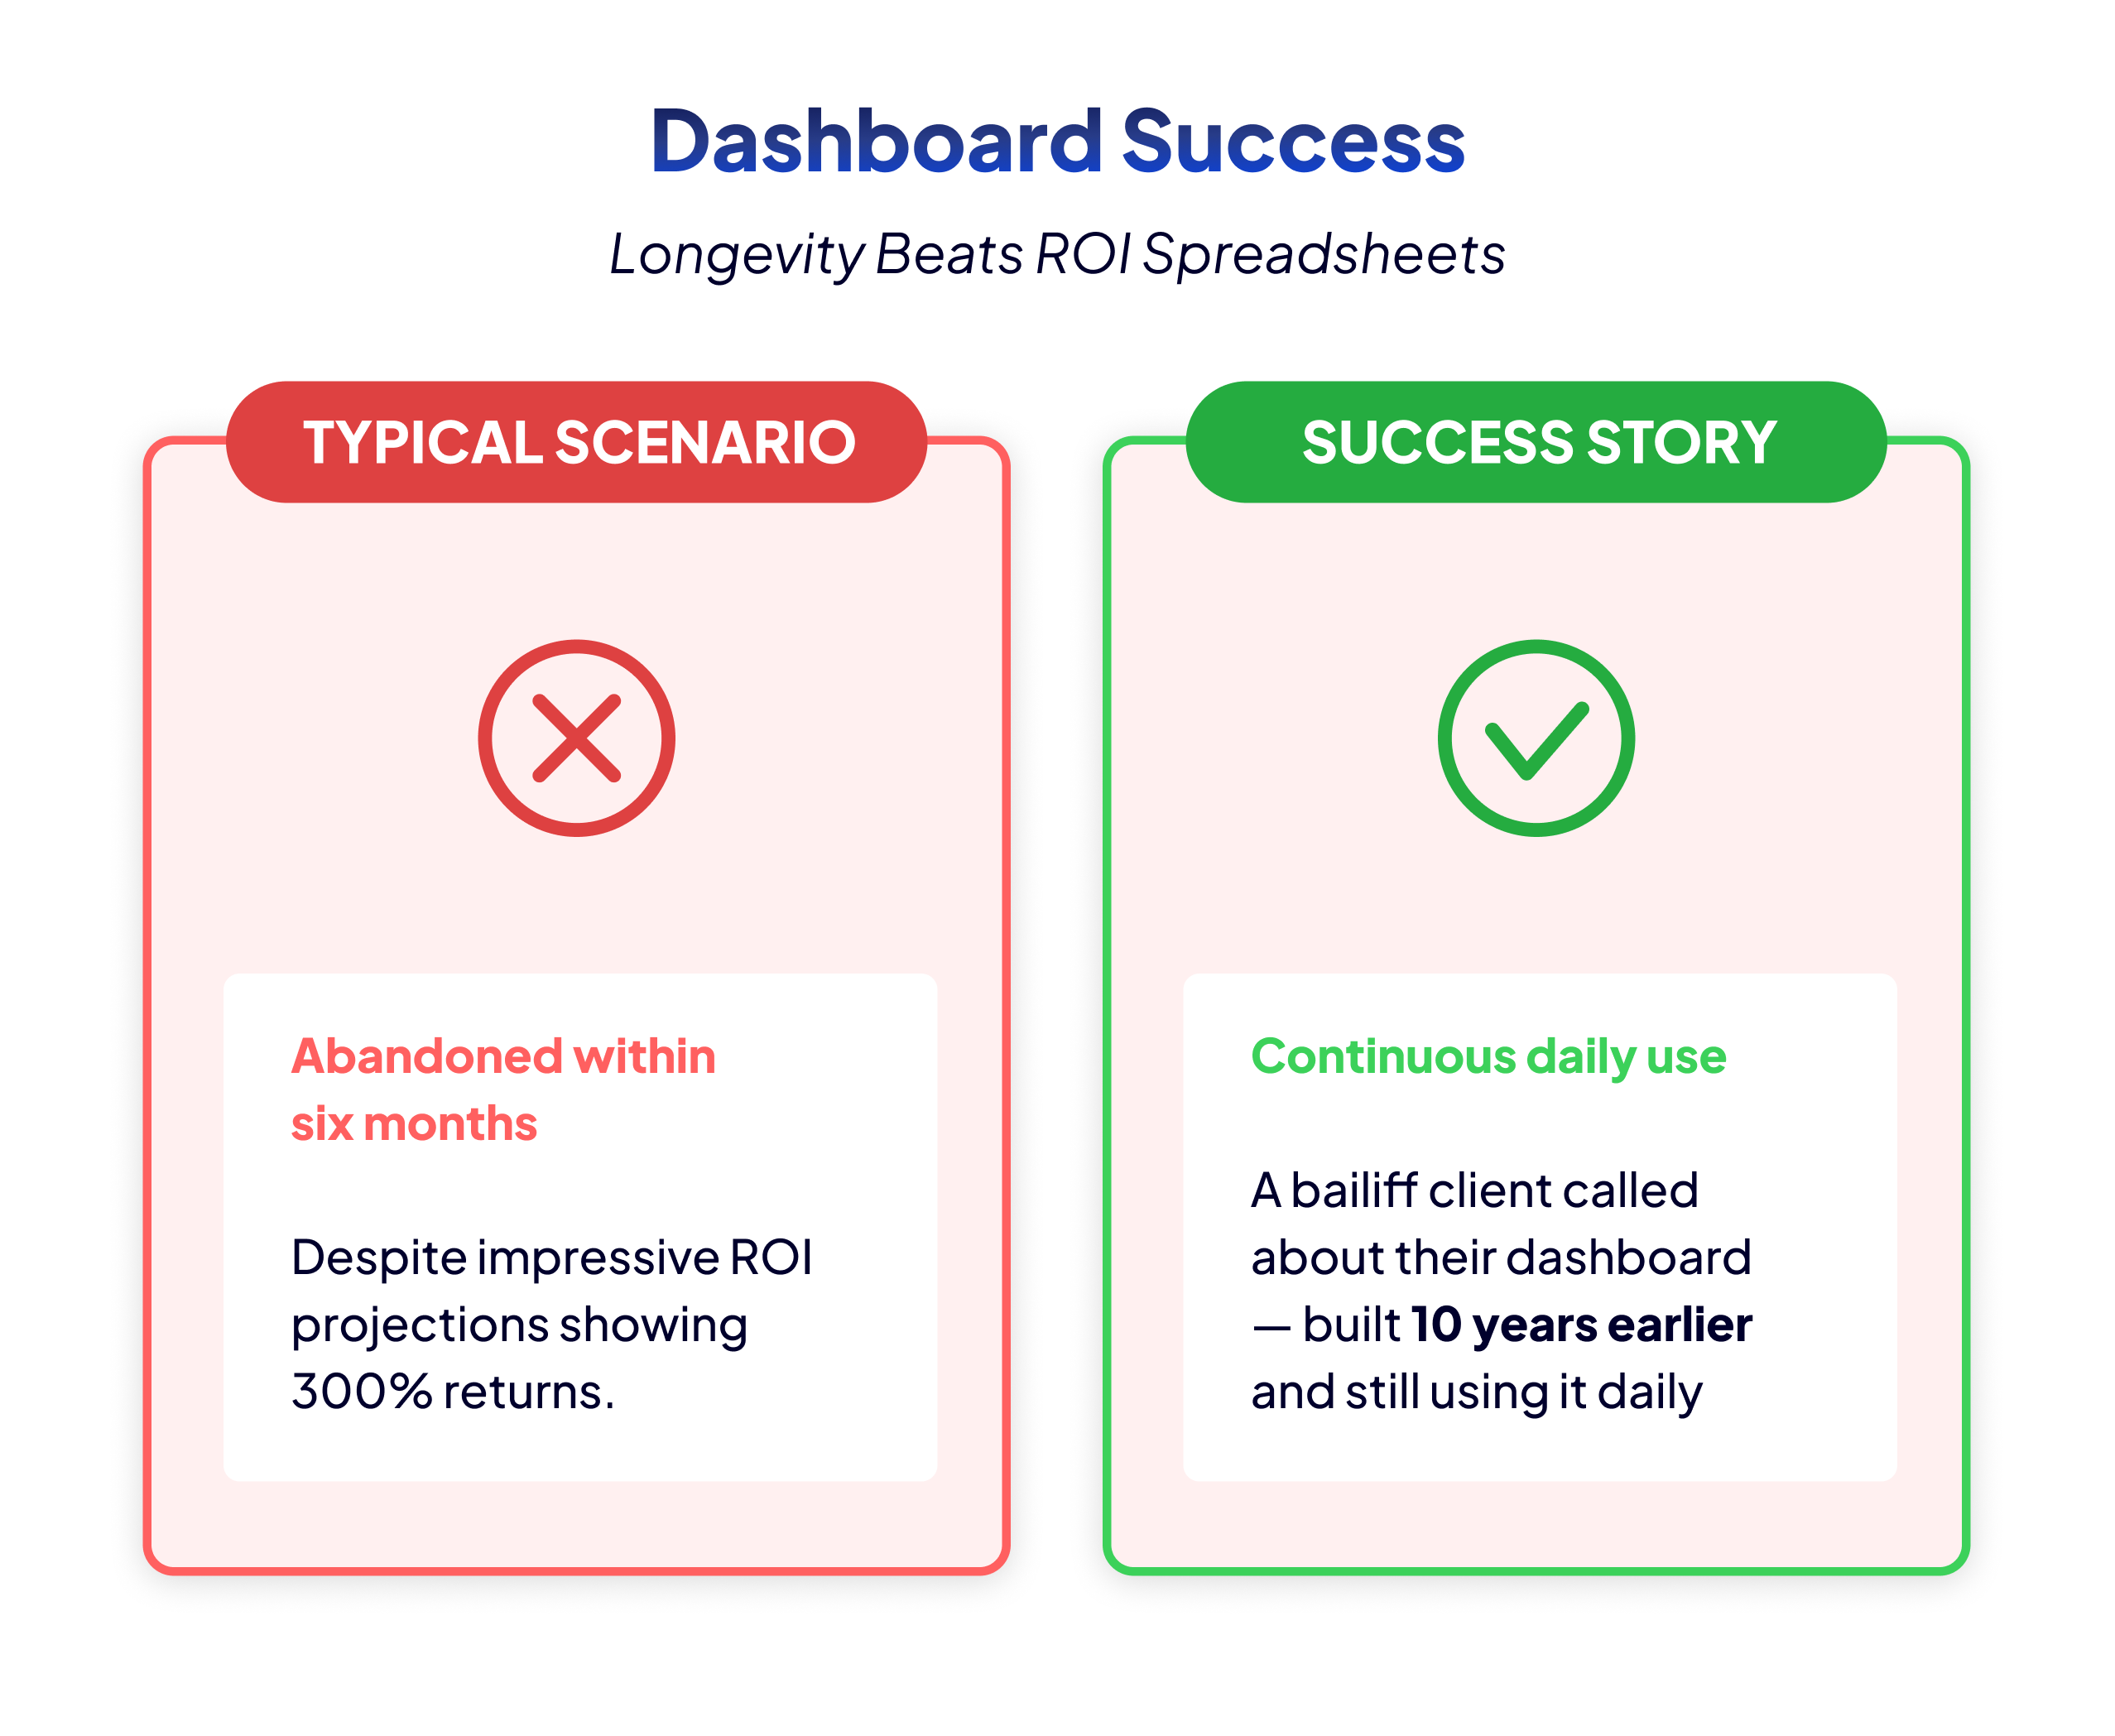
Bart recalls a phone call that validated his entire approach to dashboard development. “A bailiff client called me last year about a problem with their dashboard,” he shares. “This was a dashboard I had built 10 years earlier, and they were still using it daily.” No ROI calculation spreadsheet could compete with that simple fact: a decade of continuous value delivery.
This longevity test reveals what truly matters in dashboard ROI. When users voluntarily use a dashboard for years without being forced to do so, it’s delivering value. When they call you a decade later for enhancements rather than replacements, you’ve built something essential to their operations. Compare this to the typical scenario where dashboards are abandoned within six months, despite impressive ROI projections showing 300% returns.
The bailiff’s dashboard succeeded because it solved real problems. It created prioritized visit lists each morning, telling agents exactly where to go and how many colleagues to bring based on risk assessments. It calculated the probability of successfully collecting debts, allowing the team to focus on cases with 70% success probability rather than wasting time on 2% probability cases. These weren’t vanity metrics or executive eye candy; they were operational tools that made daily work possible.
The lesson is clear: stop trying to impress stakeholders with calculated ROI percentages that nobody believes. Instead, build dashboards that become so integral to operations that users can’t imagine working without them. When someone is still using your dashboard after 10 years, you don’t need a spreadsheet to prove its value. The continued usage is the proof.
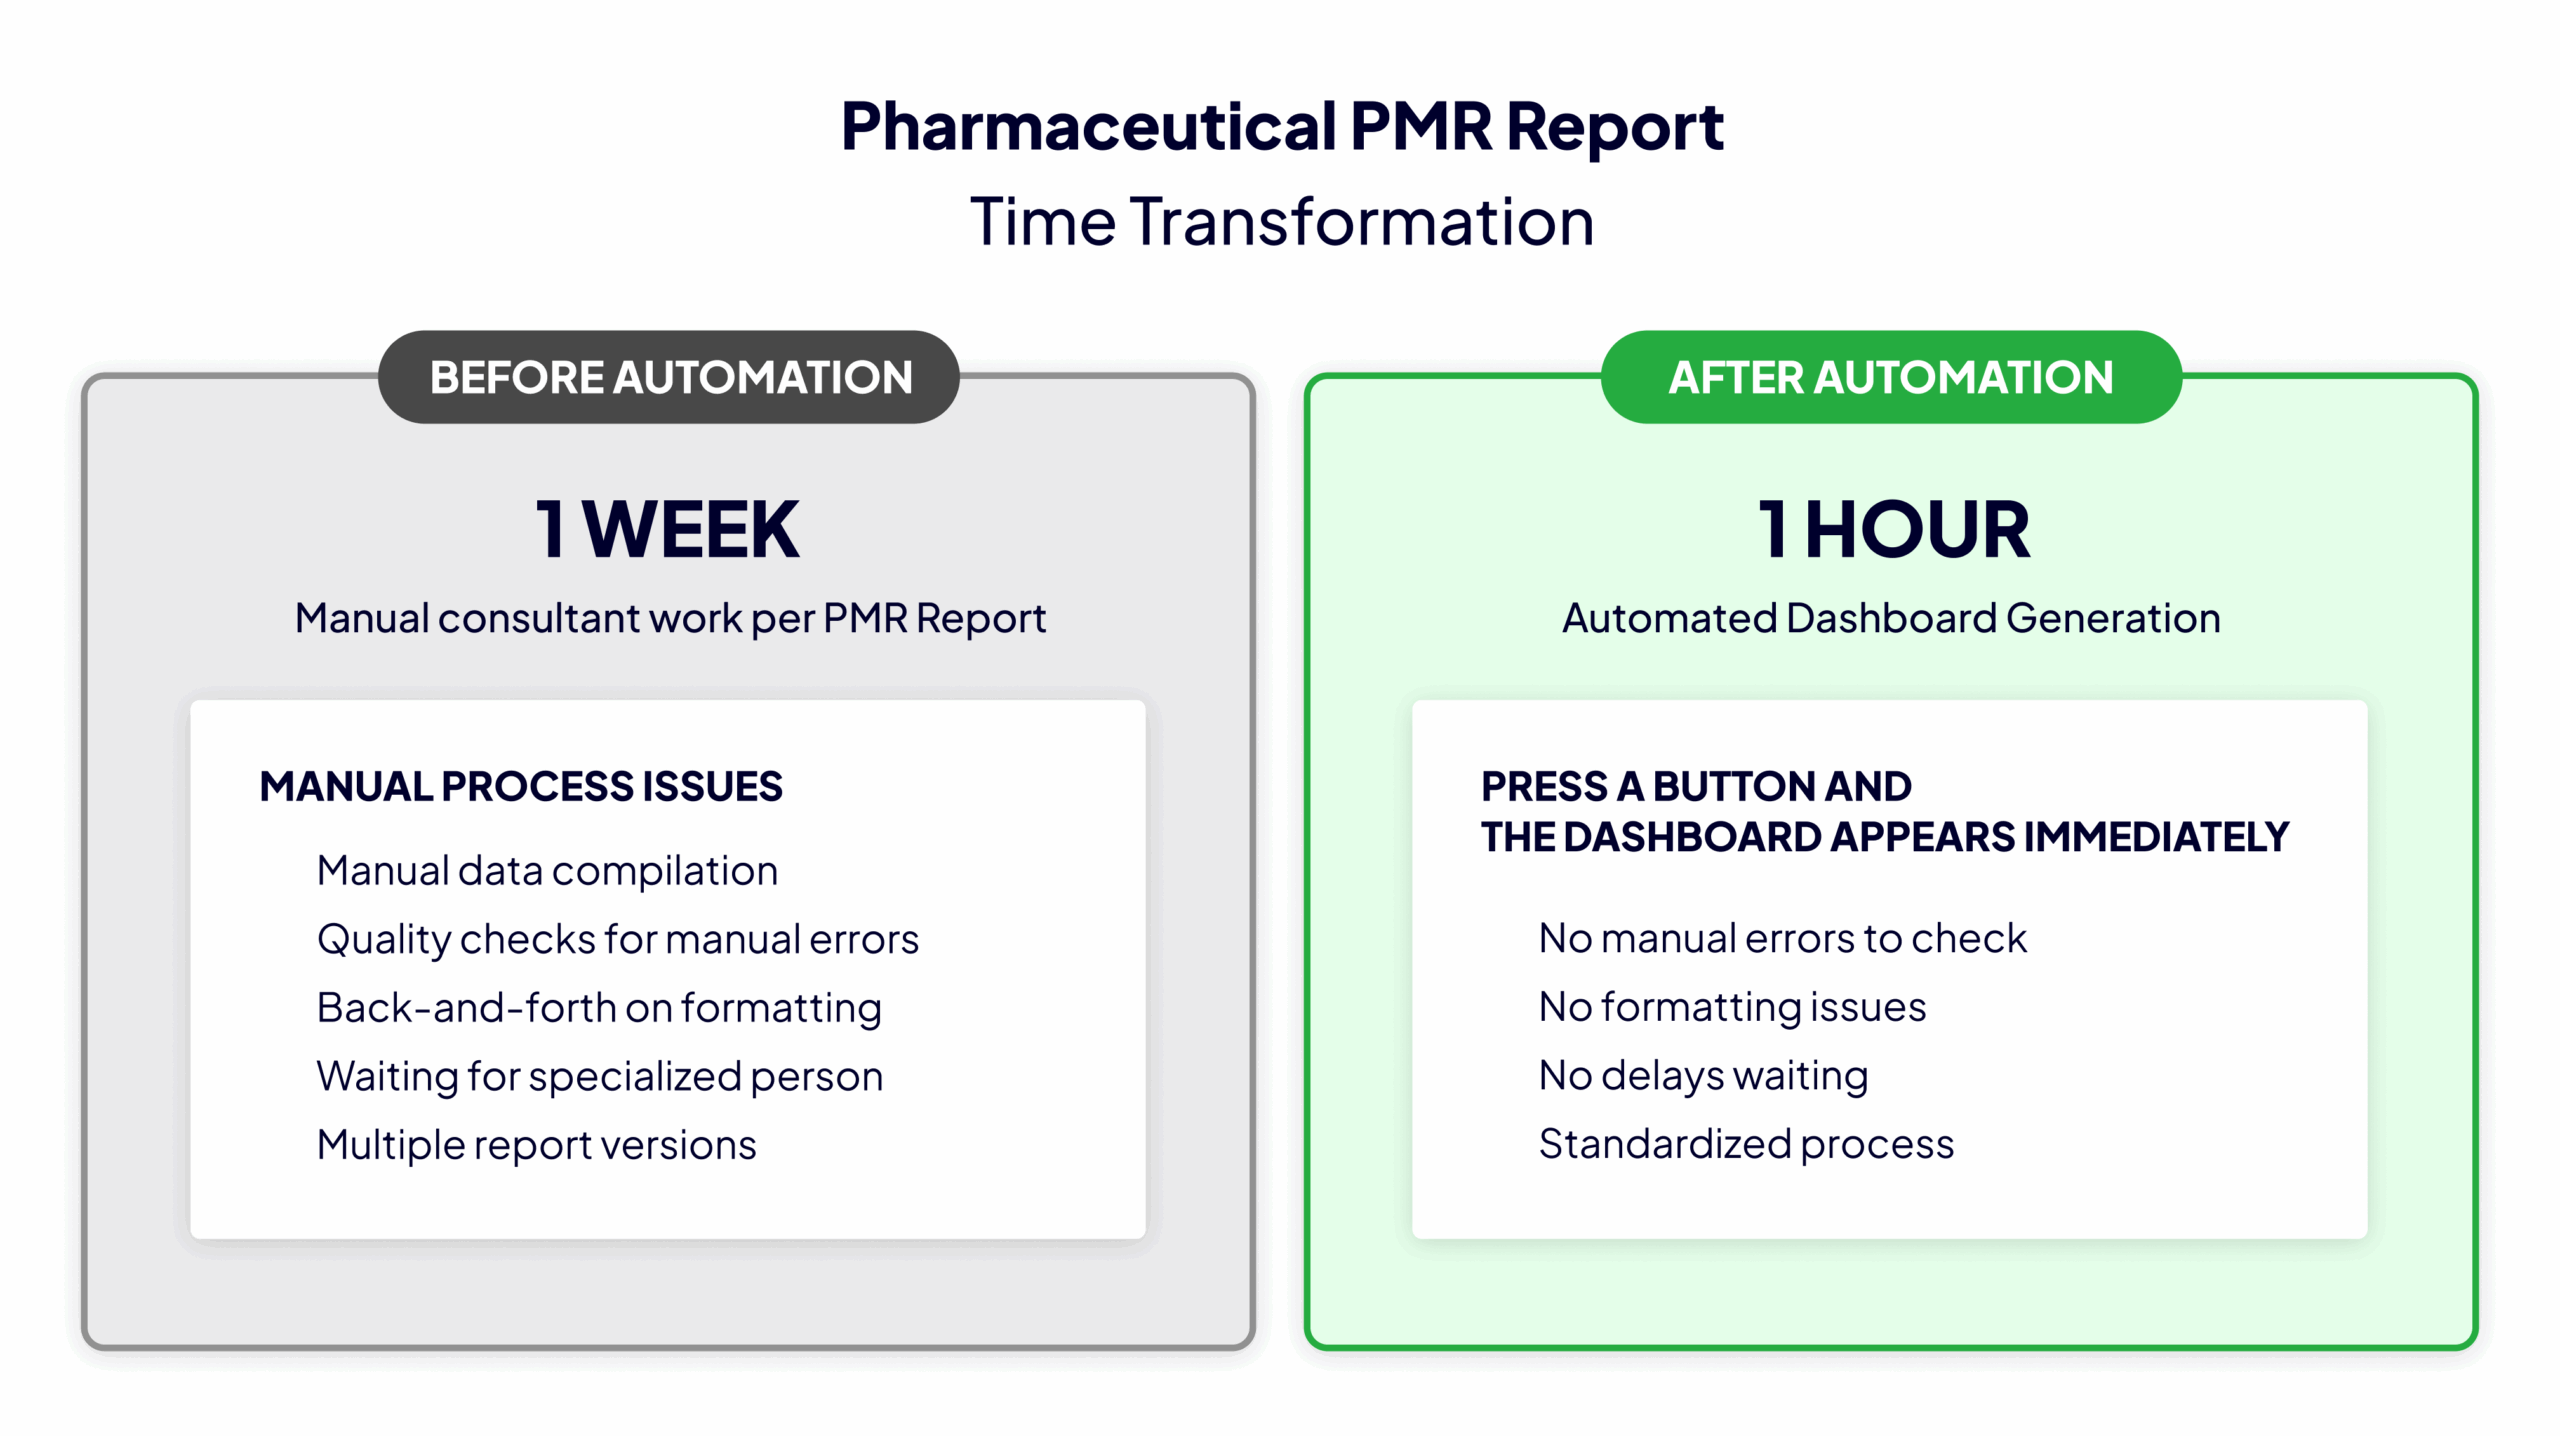
“In the beginning, a consultant spent a week per PMR report in the pharmaceutical company,” Bart recounts. “After automation, it was an hour’s work. Instead of one week of manual work, they press a button and the dashboard appears immediately.” This transformation from week to hour represents a 98% reduction in time investment, a metric that any CFO can understand and appreciate.
Time saved is the most honest ROI metric because it’s immediately verifiable. You can’t fake it. Either the monthly report that took three days now takes three hours, or it doesn’t. Either the analyst spending every Monday morning compiling data is now free to do actual analysis, or they aren’t. These are observable, measurable facts that don’t require complex calculations or assumptions about future value.
To measure time-based ROI effectively, document the current state before building anything. How long does it take to answer common business questions? Which recurring reports consume the most hours? Where do analysts spend time on repetitive data preparation? Create a simple time log: task name, frequency, current time required, and people involved. This becomes your baseline for comparison.
After dashboard implementation, measure the same tasks again. But here’s the crucial part: don’t just measure the time to run the dashboard. Measure the complete cycle from question to answer. Include the time saved in meetings because everyone sees the same numbers. Count the hours not spent reconciling different versions of the truth. Factor in the reduction in email chains asking for clarifications.
The pharmaceutical PMR case delivered additional time savings beyond the obvious. The standardized, automated process meant no more quality checks for manual errors, no more back-and-forth on formatting, and no more delays waiting for the one person who knew how to create the report. When you multiply these savings across dozens of PMRs per year, the ROI becomes undeniable without any fuzzy math required.
“How do you measure good decisions?” Bart asks. “It’s the people you work for who know which decisions they need to make. My goal as an external consultant is to ensure they have all the data to make decisions. But which decisions they make, that depends on the business itself.” This philosophy transformed a Flemish government department’s subsidy monitoring from guesswork to precision.
Before Bart’s dashboard, the department could perform one or two random subsidy audits per week, essentially gambling on which organizations to investigate. They couldn’t answer basic questions like “How much subsidy money is at risk?” or “Which organizations show compliance red flags?” After implementation, the dashboard automatically generated prioritized lists of organizations requiring immediate review, with specific reasons for investigation clearly highlighted.
The value here isn’t just efficiency; it’s decision quality. When you transform “let’s randomly check these two organizations” into “these five organizations show 10% fund misallocation patterns,” you’re not just saving time. You’re preventing fraud, ensuring compliance, and protecting public funds. The dashboard enabled decisions that were previously impossible due to information limitations.
To measure decision-enabling ROI, track decision frequency and quality. How many decisions does your dashboard inform daily? What’s the average value of these decisions? More importantly, what decisions are now possible that weren’t before? The government department went from making two random audit decisions weekly to dozens of targeted, data-driven compliance decisions. Each prevented misallocation represents real money saved, far exceeding any traditional ROI calculation.
The key is making insights actionable, not just visible. Instead of showing “Compliance Score: 72%”, the dashboard states “Organization X requires immediate audit: €100,000 potential misallocation detected.” This transforms data from something you look at into something you act upon. When every dashboard element points to a specific action or decision, proving ROI becomes straightforward: count the decisions made and actions taken.
Calculating ROI for problems that didn’t happen seems paradoxical, yet Bart’s bailiff dashboard proves it’s possible. “The dashboard calculated what the chance was of effectively collecting money, yes or no,” he explains. “If they had a 2% chance of collecting, they wouldn’t pursue it. If the chance was 70%, they’d take the case.” This risk assessment prevented countless wasted hours and resources on futile collection attempts.
The value of prevention is measurable through comparison. Track your baseline: How many failed collection attempts occurred before the dashboard? What was the cost of each futile visit in terms of time, fuel, and opportunity cost? Now compare to the post-dashboard reality where agents only pursue viable cases. The difference represents real value, even though these are problems that didn’t occur rather than revenue generated.
Compliance improvements offer even clearer ROI metrics. The government department Bart worked with can now quantify exactly how much incorrectly allocated subsidy money they’ve identified and recovered. Before the dashboard: random checks catching occasional issues. After: systematic identification of every organization with more than 10% misallocation. The recovered funds directly demonstrate ROI, but the real value lies in deterrence. Organizations knowing they’ll be caught are less likely to misallocate funds in the first place.
To measure risk-reduction ROI, establish clear metrics for problems: failed projects, compliance violations, customer complaints, or operational errors. Document the frequency and cost of these issues before dashboard implementation. After implementation, track the reduction in incident rates. A 50% reduction in compliance violations, each costing €10,000 to remediate, provides clear ROI without any fuzzy calculations needed.
Remember to include soft costs in your risk calculations. A compliance violation doesn’t just cost the fine amount; it costs reputation, management time, legal fees, and potential business opportunities. When your dashboard prevents these problems, the total value far exceeds the obvious direct costs. This comprehensive view of risk reduction often reveals that prevention-focused dashboards deliver the highest ROI of all.
“I always start with asking: what do you have now?” Bart explains. “Show me how you work with your current Excel sheets, walk me through your process.” This baseline documentation becomes the foundation for proving ROI later. Without a clear “before” picture, you can’t demonstrate improvement, no matter how impressive your dashboard becomes.
Creating compelling before-and-after documentation doesn’t require complex process mapping software. Start with a simple table: Task name, who does it, how often, how long it takes, and what tools they use. Ask users to walk through their typical Monday morning routine or month-end reporting process. Record everything: the five Excel files they open, the three emails they send requesting data, the two hours spent in meetings reconciling numbers.
When documenting the “after” state, capture the same processes with the dashboard in place. But don’t stop at obvious time savings. Document the qualitative improvements too. The analyst who previously spent mornings compiling data now spends that time investigating anomalies. The manager who ran weekly two-hour meetings to align on numbers now runs 15-minute stand-ups focused on actions. The executive who waited three days for reports now gets instant answers during board meetings.
Visual workflow comparisons make ROI tangible for stakeholders. Create simple flow diagrams showing the before state: multiple people, multiple systems, multiple handoffs, multiple delays. Then show the after state: one dashboard, immediate access, single source of truth. When stakeholders see a 12-step process reduced to three steps, they understand the value without needing percentage calculations.
The most powerful before-and-after stories include user testimonials. Quote the analyst: “I used to dread Monday mornings. Now I actually have time to think about what the data means.” Quote the manager: “We’ve eliminated our Friday reconciliation meetings entirely.” These human stories resonate more than any ROI percentage because they capture the real impact on people’s daily work lives. When someone says your dashboard gave them their Fridays back, that’s ROI everyone understands.
The most honest ROI metric might be the simplest: Is anyone actually using the dashboard? Bart encountered this reality at a client with 6,000 apps in their QlikView environment. “I investigated and found that 10% were effectively used. The rest were copies of copies with modifications that nobody ever opened,” he discovered. They were paying for server capacity to run 5,400 unused dashboards while asking for upgrades to handle the load.
Usage metrics tell the truth that ROI calculations often hide. Track daily active users, average session duration, and most importantly, return visitors. A dashboard with an impressive projected ROI but only two monthly users is failing. Conversely, a simple operational dashboard checked by 50 people every morning is delivering continuous value, even if you never calculated a percentage return.
Set up usage monitoring from day one. Who logs in? How often? Which features do they use? Which reports do they export? This data reveals actual value delivery versus theoretical value. When you see usage growing organically without forcing people to adopt the dashboard, you know you’ve built something valuable. When departments you’ve never talked to start requesting access, that’s ROI without any calculation needed.
Pay special attention to usage evolution. The bailiff’s dashboard that Bart built evolved from a simple prioritization tool to include risk assessment and probability calculations. Users don’t request enhancements to dashboards they don’t value. When someone asks for new features, they’re essentially saying, “This is so valuable that we want more of it.” Track these expansion requests as ROI indicators.
The ultimate usage of validation comes when problems arise. “When the dashboard broke after 10 years, they called me immediately to fix it,” Bart recalls. “They couldn’t work without it anymore.” This dependency, while sometimes concerning from a business continuity perspective, represents the highest form of ROI validation. When your dashboard breaking constitutes an operational emergency, you’ve proven its value beyond any spreadsheet calculation. The panic when it’s unavailable is proportional to the value it delivers when it works.
Proving dashboard ROI doesn’t require complex calculations or fuzzy math. It requires observable, measurable improvements in how people work. When a dashboard reduces a week-long process to an hour, enables dozens of targeted decisions instead of random guesses, or prevents costly compliance violations, the value is undeniable.
Start proving your dashboard’s value today with this simple exercise: Document one current process that frustrates your users. Time it, map it, and capture the pain points. Build a dashboard that addresses just this one process. Measure the improvement. When you can show that you gave someone their Monday mornings back or eliminated their Friday reconciliation meetings, you’ve proven ROI in terms that everyone understands.
Your Next Step: Choose your most painful recurring report or analysis. Document exactly how long it takes today, including all the preparation, validation, and distribution time. This becomes your baseline for proving real, measurable ROI when your dashboard transforms hours into minutes.